Storytelling with Data Before & After: Makeovers for Charts That Drive Decisions
Data does not speak for itself. Storytelling with Data: Before & After shows—through practical makeovers—how the same numbers become noise or a decision tool depending on audience, tension, visual form and focus. For consultants and AI teams, this is the difference between a dashboard graveyard and a board action.
Source note: This article is an original practitioner synthesis of themes from Cole Nussbaumer Knaflic, Mike Cisneros and Alex Velez’s Storytelling with Data: Before & After. It is not a reprint. Figures are educational illustrations; support the original book for the full makeover library and design rationale.
0. Why this book still matters
The first Storytelling with Data book established principles. Before & After is the practicum: dozens of real-world makeovers showing how practitioners moved from confusing to clear. In consulting and AI, teams ship dashboards faster than ever—and decision quality often falls because explanatory craft did not keep pace.
Knaflic’s core insistence: context is not optional. A chart without audience, stakes and a requested action is decoration.
Three commitments organise the makeovers:
- Explanatory communication is a different job from analysis.
- Every element on a slide must earn its place.
- Titles should state the insight, not label the data series.
1. Before storytelling — audience and tension
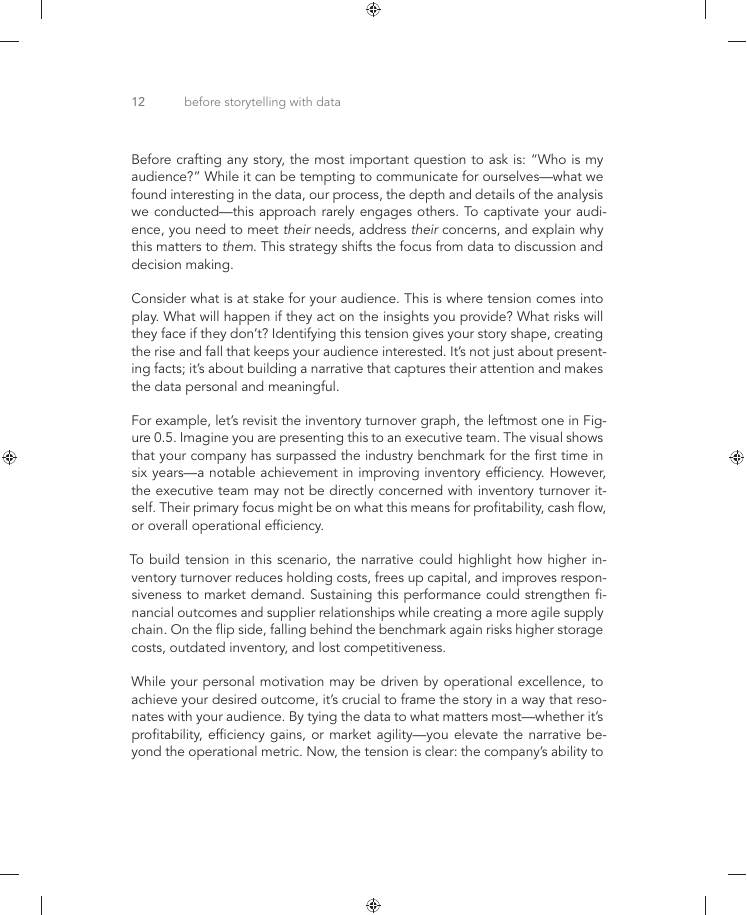
Figure: ask “Who is my audience?” and build tension around what they stand to gain or lose—not what you find interesting.
1.1 Audience questions
| Question | Why it matters |
|---|---|
| Who decides? | Titles and metrics must match their job |
| What do they fear? | Tension and urgency |
| What action is possible? | Explanatory charts exist to drive action |
| What is background vs foreground? | Declutter ruthlessly |
| What do they already believe? | Avoid re-proving the obvious |
1.2 Tension — stakes, not drama
Tension is the gap between current state and desired state with consequences:
| Weak tension | Strong tension |
|---|---|
| “Here is skip rate data” | “Day-1 skips cost £2.1m/quarter in rework” |
| “GPU costs rose” | “Run-rate exceeds budget by November without action” |
| “Model accuracy improved” | “Remaining failure mode blocks production sign-off” |
Example: Inventory turnover beating a benchmark is not the story for executives—cash freed / holding cost avoided / competitiveness at risk is.
1.3 Big idea and storyline
Before opening Excel or BI tools, write:
- Audience
- Big idea (one sentence)
- Requested action
- 3–5 supporting points (pyramid-aligned—see Minto)
2. Exploratory vs explanatory
| Mode | Goal | Visual style |
|---|---|---|
| Exploratory | Find patterns; many charts OK | Dense, flexible, personal |
| Explanatory | Make one point clear | Sparse, annotated, audience-ready |
Showing exploratory graphs in explanatory settings is a common failure: the audience re-does your analysis live—and often wrongly.
2.1 Handoff discipline
| Role | Delivers |
|---|---|
| Analyst | Exploratory workbook / notebook |
| Communicator | Explanatory slide with one point |
| Reviewer | “10-second comprehension” test |
3. Makeover principles
3.1 Declutter
Remove borders, unnecessary gridlines, redundant legends, 3D, decorative clipart, and colours that encode nothing.
| Clutter source | Fix |
|---|---|
| Heavy gridlines | Light or none |
| Duplicate labels | Direct labelling |
| Default legend | Label series on chart |
| 3D bars/pies | Flat 2D |
| Logo wallpaper | One small logo max |
3.2 Focus attention
Pre-attentive attributes: position, colour, size, bold annotation. Highlight the point; mute the rest (grey baseline series).
Rule: If everything is bold, nothing is bold.
3.3 Choose effective visuals
| Question | Prefer | Avoid (often) |
|---|---|---|
| Compare categories | Bars | Pies for many slices |
| Trend over time | Lines | Dual axes without care |
| Part-to-whole | Stacked bars, square area | 3D pies |
| Precise lookup | Table + highlight | Chart junk |
| Distribution | Histogram, boxplot (exploratory) | Pie of quartiles |
| Relationship | Scatter (exploratory) | Spurious dual axis |
3.4 Square area / waffle charts
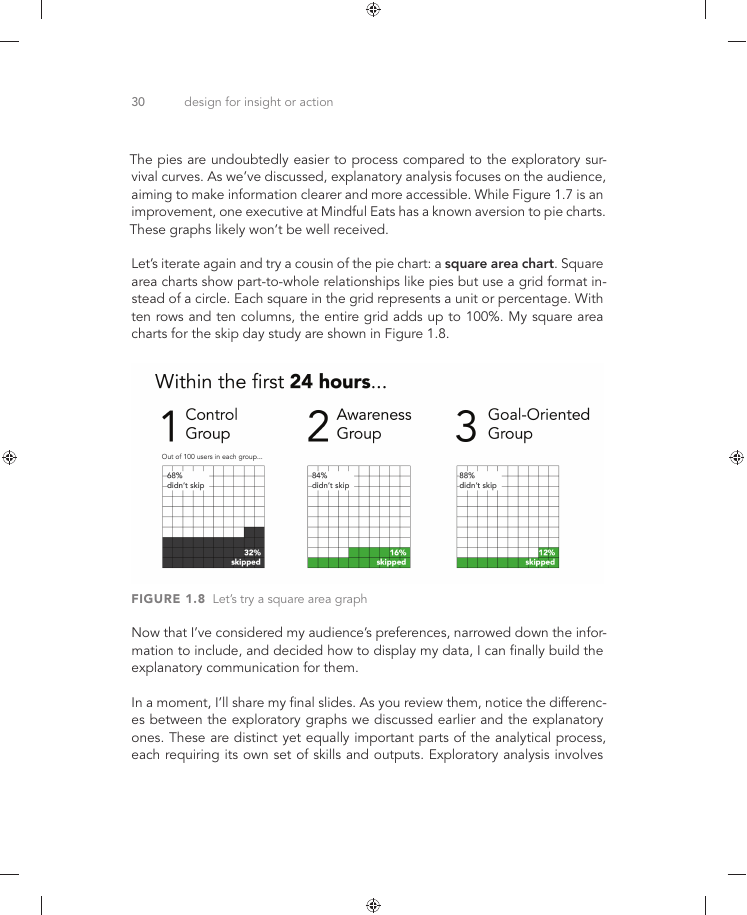
Figure: a 10×10 square area graph can communicate part-to-whole more accessibly than pies for some audiences.
When to consider:
- Small number of categories
- Audience struggles with pie angle perception
- Need intuitive “counting squares” metaphor
3.5 Action titles
Bad: “Skip rate by cohort.”
Better: “Goal-oriented prompts cut Day-1 skips from 32% to 12%.”
| Title type | Function |
|---|---|
| Topic | Names the data |
| Action | States the insight + implication |
Align slide titles with Minto point titles.
4. Narrative structure for data stories
- Context — situation the audience recognises
- Tension — what is at stake if we ignore this
- Insight — what the data shows (one primary point per slide)
- So what — implication
- Now what — decision / next experiment / investment
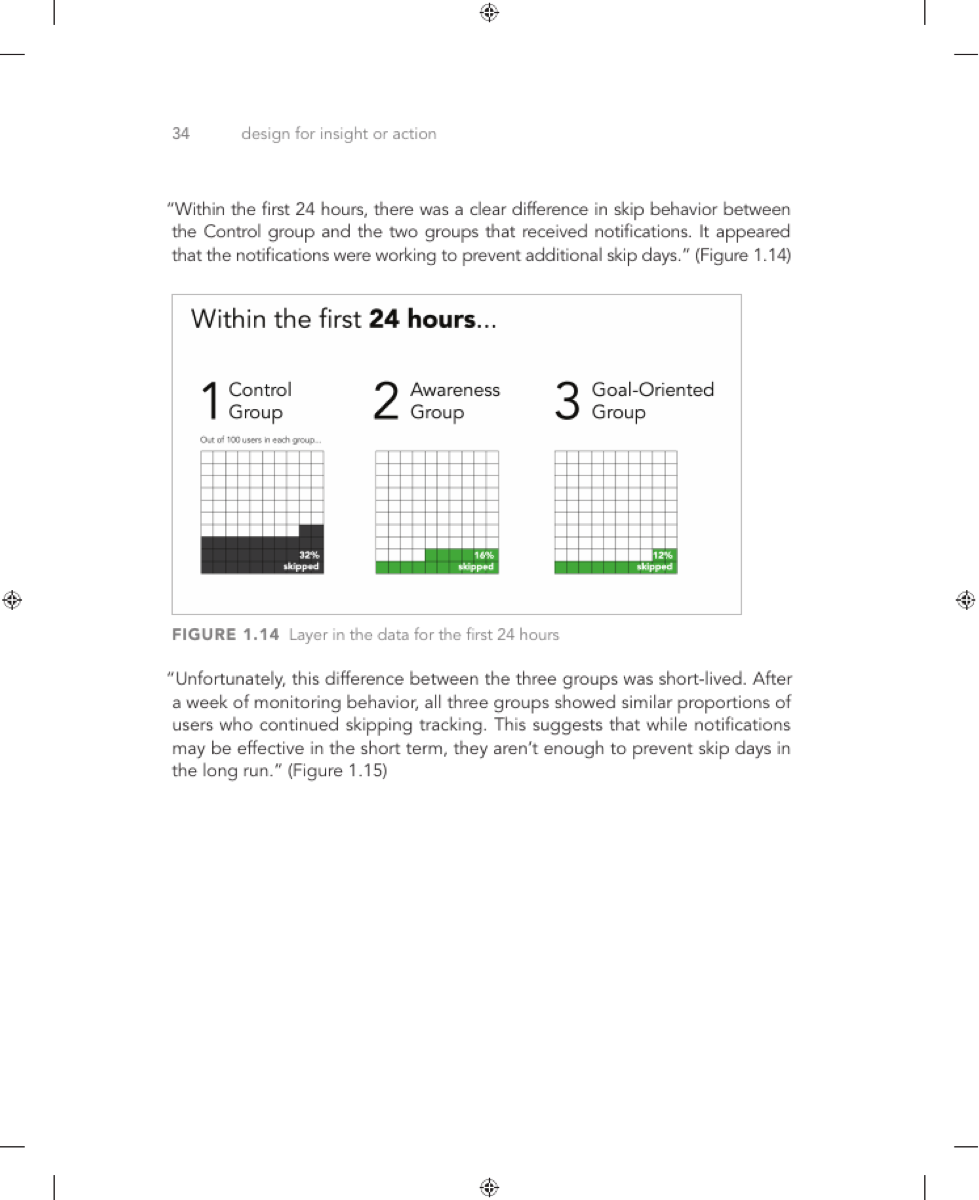
Figure: additional educational before/after makeover page from Storytelling with Data: Before & After.
Figure: before/after craft is not decoration—it is sequencing insight for action.
4.1 Pacing and repetition
| Technique | Use |
|---|---|
| Horizontal logic | Same chart type across slides for comparison |
| Build slides | Reveal series stepwise in live presentation |
| Summary slide | Recap big idea before ask |
5. Before/after working method
For each chart:
- State the intended audience action
- Screenshot “before”
- List clutter and confusion sources
- Redesign with one focal point
- Write why each change helps cognition (required in the book’s pedagogy)
- Test with a colleague for 10-second comprehension
5.1 Makeover checklist
- Audience named
- Single takeaway sentence
- Chart type matches question
- Highlighting guides the eye
- Title states the point
- Next decision is explicit
- Appendix holds detail
5.2 Document the rationale
Consulting teams should store before/after pairs in a visual standards library—new analysts learn faster from documented “why” than from brand guidelines alone.
6. Common makeover patterns (synthesis)
| Before pattern | After pattern |
|---|---|
| Pie with 8 slices | Bar sorted descending or small-multiples |
| Dual axis implying causation | Separate charts or indexed line |
| Rainbow categories | Grey + one accent colour |
| Chart + paragraph duplicating | Chart + annotation callout only |
| Dashboard screenshot in slide | One metric per slide for exec readout |
| Percentages without denominator | Label n and absolute impact |
7. Consulting and AI applications
7.1 Artefact map
| Artefact | SWD move |
|---|---|
| AI eval readout | One metric per slide; annotate failure modes |
| FinOps LLM cost | Trend + unit cost; highlight actionable driver |
| Experiment results | Control vs treatment with plain language effect |
| Risk dashboard | Mute green noise; spotlight exceptions |
| Pursuit commercial | Tie visuals to value case and explicit needs (SPIN) |
| Model comparison | Same scale; highlight winner on decision criterion only |
7.2 AI-specific pitfalls
| Pitfall | Fix |
|---|---|
| Leaderboard of 12 metrics | One decision metric + appendix |
| Confusion matrix raw in exec deck | Highlight error type that blocks launch |
| Training loss curves | Keep exploratory; show business metric explanatory |
| Token cost vanity | Unit economics per successful task |
7.3 Integration with pyramid structure
| Pyramid level | SWD role |
|---|---|
| Governing thought | Big idea sentence |
| Key lines | One slide each with action title |
| Evidence | Chart supports title only |
8. Negative cases (expanded)
| Failure | Symptom | Fix |
|---|---|---|
| Rainbow colours | Legend required; no focus | Single accent |
| Dual axis abuse | False causation | Split or index |
| 40-KPI dashboard | No decision | Exception-based exec view |
| Raw exploratory in exec meeting | Live mis-analysis | Explanatory subset |
| Story without ask | “Interesting” meeting | Now what slide |
| Makeover without rationale | Inconsistent team standards | Document why |
| Chart type mismatch | Bars for long time series | Line chart |
9. Capstone — redesign one slide today
- Pick a noisy slide from your last readout.
- Write audience, tension, and the decision you want.
- Produce a before/after pair.
- Explain five changes in bullets (cognitive rationale).
- Rehearse a 60-second verbal story ending with the ask.
- File in team visual library.
10. Team operating cadence
| Cadence | Activity |
|---|---|
| Weekly | One makeover share in team meeting |
| Per pursuit | Explanatory pack review before steering |
| Quarterly | Refresh visual standards from new makeovers |
11. Colour, typography and accessibility
11.1 Colour with purpose
| Use accent colour for | Avoid |
|---|---|
| The one series or bar that proves the point | Every category a different hue |
| Annotations and callouts | Decorative gradients |
| Exception states in risk charts | Red/green-only KPI walls |
Check contrast for accessibility; do not rely on colour alone—add labels.
11.2 Typography hierarchy
| Element | Role |
|---|---|
| Action title | Insight (largest text on slide) |
| Subtitle | So-what in one line |
| Axis labels | Minimal; direct label when possible |
| Footnote | Source, date, denominator |
11.3 Accessibility checklist
- Chart readable in greyscale print
- Font size ≥ 18pt for exec rooms
- Data labels on key points for colour-blind viewers
- Animation disabled in PDF handouts
12. Verbal presentation — the 60-second chart story
- Context (10s): “You asked whether the pilot reduced handle time.”
- Tension (10s): “SLA breaches cost £400k last quarter.”
- Insight (20s): Walk one visual focal point only.
- So what (10s): “We can extend to Tier-2 if approved.”
- Ask (10s): “Approve Phase 2 budget today.”
Practice without reading the slide—if you must read, the slide failed.
13. Consulting pursuit pack template
| Slide # | Pyramid role | SWD element |
|---|---|---|
| 1 | SCQA | Tension statement |
| 2 | Governing answer | No chart—bold recommendation |
| 3–5 | Key lines | One action title chart each |
| 6 | Risks | Exception-focused visual |
| 7 | Ask | Decision + owners |
| Appendix | Evidence | Exploratory detail |
Pair with Never Split the Difference: present after “That’s right” on the problem frame.
14. AI eval readout example (synthetic pattern)
| Slide title (action) | Chart choice |
|---|---|
| “Citation mode cuts unsupported answers from 18% to 3%” | Before/after bar |
| “Remaining failures cluster on ambiguous policy edge cases” | Pareto bar |
| “Human review time drops 22 min → 9 min per case” | Simple line or paired bar |
| “Recommend: expand to Tier-2 with same eval gates” | Text ask slide |
Each title states the insight; appendix holds confusion matrices and full leaderboard.
15. Makeover catalogue — common chart types
Knaflic’s Before & After library repeats patterns. Practitioners should recognise these before states instantly:
| Before pattern | Cognitive problem | After move |
|---|---|---|
| 3D pie, exploded slices | Angle comparison fails | Sorted bar or square area |
| Dual y-axis | Implied false correlation | Indexed lines or separate panels |
| Stacked area with 8 series | No focal point | Small multiples or highlight one series |
| Table with no highlight | Lookup burden | Grey rows + accent on decision row |
| Map with identical choropleth | Geographic ≠ priority | Bar of top regions only |
| Sparkline grid without context | No stakes | One trend + annotated event |
| Waterfall without subtotal labels | Hard to reconcile | Label each bridge step |
Document the question type first (compare, trend, part-to-whole, distribution, relationship)—then pick the form.
16. Dashboard vs slide — different jobs
| Artefact | Purpose | SWD rule |
|---|---|---|
| Operational dashboard | Monitor exceptions | Many metrics OK; alert on breach |
| Exec steering slide | Decide one thing | One point per slide |
| Analyst workbook | Explore | Full density |
| Board pack | Approve / redirect | Explanatory subset only |
Negative case: Exporting a live dashboard screenshot into a board deck without redesign—audience drowns, no ask lands.
17. FinOps and LLM cost storytelling
| Audience | Tension | Action title example |
|---|---|---|
| CFO | Run-rate vs budget | “Token spend tracks 18% above plan—routing Tier-2 to smaller model saves £140k/qtr” |
| Engineering lead | Cost vs latency trade-off | “P95 latency unchanged when cache hit >60%” |
| Product owner | Unit economics per task | “Cost per resolved ticket down 34% post-prompt refactor” |
Always show denominator (tasks, users, sessions) alongside spend—raw token totals alone mislead.
18. Experiment readout template (A/B)
| Slide | Content |
|---|---|
| 1 | Hypothesis + decision criterion (pre-registered) |
| 2 | Primary metric effect with CI or clear n |
| 3 | Guardrail metrics (quality, latency) — exceptions only |
| 4 | Segment slice if heterogeneity matters (one slide max) |
| 5 | Ship / iterate / kill recommendation |
Avoid peeking narrative—state whether the test hit power and duration planned.
19. Consulting QA rubric (peer review)
Score each slide 1–5 before steering:
| Criterion | 1 (fail) | 5 (pass) |
|---|---|---|
| Audience fit | Wrong exec level | Named decision-maker |
| Tension | None | Quantified stakes |
| Takeaway | Topic title | Action title |
| Visual form | Mismatch | Matches question |
| Focus | Rainbow noise | One accent |
| Ask | Missing | Owner + date |
Reject packs averaging <4 on any criterion for C-suite readouts.
20. Capstone — team makeover sprint (half day)
- Hour 1: Each analyst brings one “before” slide + intended decision.
- Hour 2: Pair redesign; write five “why” bullets per slide.
- Hour 3: 10-second comprehension test with a colleague outside the team.
- Hour 4: Publish to visual standards library; tag by chart type.
21. Annotated before/after — annotation checklist
When annotating charts:
| Annotation type | Use for |
|---|---|
| Direct label | Remove legend clutter |
| Callout box | Single exception bar/point |
| Reference line | Target, benchmark, threshold |
| Shaded band | Acceptable range only |
| Arrow | One direction of change |
Maximum two annotation types per slide—more becomes clutter again.
22. Source line and trust
Every explanatory chart should show:
| Element | Example |
|---|---|
| Data source | “CRM extract, 2026-03-01” |
| Definition | “Active user = logged in ≥1× in 30d” |
| Caveat | “Excludes pilot cohort n=12” |
Skeptical executives trust provenance as much as design—one footnote line prevents ten minutes of challenge.
Discussion
Comments
Share feedback or questions about this page. No account required.
Loading comments…