Financial Intelligence: The Complete Manager’s Guide to Reading the Numbers
Most managers do not fail because they cannot add. They fail because they treat the financial statements as facts carved in stone—when every profit number, every asset value, and every “healthy” ratio rests on assumptions, estimates, and biases. Once you see the art behind the science, you stop being intimidated by finance and start using it as a decision language.
Source note: This article is an original practitioner synthesis of themes from Karen Berman, Joe Knight, and John Case’s Financial Intelligence (revised edition). It is not a reprint of the book. Support the original work if you manage P&L, budgets, projects, client commercial cases, or any role where “the numbers” shape decisions.
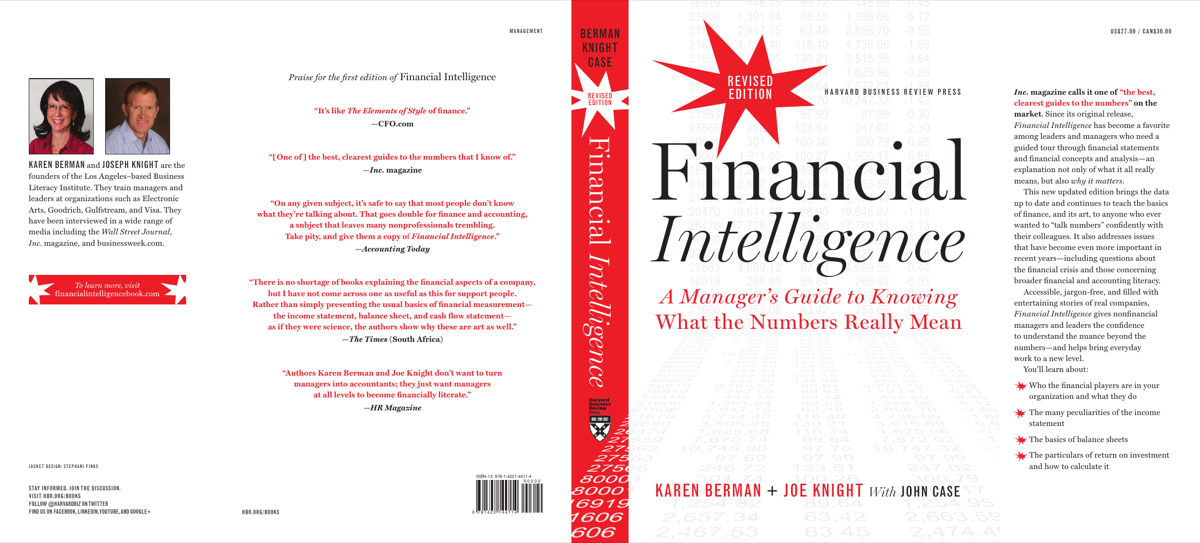
Figure: cover of Berman, Case & Knight, Financial Intelligence (educational illustration).
0. Why this book still matters for operators
Berman, Knight, and Case wrote for people who were never meant to be accountants—and who still get judged by accounting outcomes. The revised edition keeps the same thesis:
Finance is both art and science. The science is the rules (GAAP/IFRS, double-entry, statement structure). The art is the estimates and assumptions that fill every material line.
Without financial intelligence, managers:
- Celebrate revenue that may reverse.
- Cut “costs” that are really investments.
- Approve projects on ROI theatre.
- Miss cash crises while the P&L still looks fine.
- Let finance own a monopoly on interpretation.
With it, they ask better questions: What estimate sits under this number? What would change the story? Where is the cash?
This guide follows the book’s arc: art of finance → income statement → balance sheet → cash → ratios → ROI → working capital → the financially intelligent company—with practitioner tables and checklists you can use in reviews, pursuits, and operating meetings.
1. The art of finance: assumptions, estimates, and bias
1.1 Soft numbers hiding in hard reports
A financial statement looks precise: two decimals, neat columns, auditor signatures. Precision is not the same as objectivity. Material soft spots include:
| Soft area | Typical judgment | Why it matters |
|---|---|---|
| Revenue recognition | When is a sale “earned”? Multi-element contracts, licences, long-term projects | Pulls profit forward or pushes it back |
| Allowance for doubtful accounts | What % of receivables will never collect? | Expense today vs. overstated assets |
| Inventory valuation / obsolescence | FIFO vs. other methods; write-downs | Gross margin and asset strength |
| Depreciation / amortisation lives | Useful life and residual value | Timing of expense; asset book value |
| Warranty / returns reserves | Expected future claims | Can smooth or spike earnings |
| Goodwill impairments | Is the acquired business still worth the premium? | Big non-cash hits (or delayed ones) |
| Provisions and contingencies | Probability and amount of future outflow | Balance-sheet risk vs. P&L surprise |
Plain-language rule: if a human had to guess a future, that line is art. Treat it as a hypothesis with a confidence interval, not as a thermometer reading.
1.2 Bias is not always fraud
Bias often looks like optimism under pressure:
- Stretching useful lives to protect current earnings.
- Under-reserving for returns in a growth story.
- Capitalising costs that competitors expense (or the reverse for “quality of earnings” theatre).
- Channel stuffing that books revenue before real demand.
- One-time “adjustments” that somehow recur every year.
Financial intelligence does not require accusing colleagues of fraud. It requires asking: who benefits if this estimate tilts this way?
1.3 The three statements as one system
| Statement | Question it answers | Time nature |
|---|---|---|
| Income statement (P&L) | Did we earn a profit over a period? | Flow over time (month/quarter/year) |
| Balance sheet | What do we own and owe at a moment? | Snapshot at a date |
| Cash flow statement | Where did cash come from and go? | Flow of cash (not accrual profit) |
They articulate. Net income feeds retained earnings on the balance sheet. Changes in balance-sheet working-capital accounts explain why cash ≠ profit. Capex and financing show up on cash flow even when the P&L looks calm.
1.4 Practitioner checklist — art of finance
- Before debating a number, name the estimate inside it.
- Ask for the policy (revenue, capitalisation, depreciation) in one sentence.
- Compare this period’s assumptions to last period’s—consistency matters as much as level.
- Separate accounting profit from economic reality and from cash.
- When someone says “the numbers don’t lie,” reply: “Numbers don’t lie; choices do.”
2. The income statement: profit as a constructed story
2.1 The spine of the P&L
A simplified income statement:
Revenue (Sales)
− Cost of goods sold (COGS) / cost of services
= Gross profit
− Operating expenses (OpEx): SG&A, R&D, etc.
= Operating profit (EBIT / operating income)
± Other income/expense; interest
= Profit before tax
− Taxes
= Net income (the “bottom line”)
Plain language:
- Revenue — what the company claims it earned from customers in the period under recognition rules.
- COGS — direct costs of delivering what was sold (materials, direct labour, hosting tied to delivery, etc.).
- Gross profit — leftover after direct delivery cost; first test of unit economics.
- OpEx — costs of running the business (sales, admin, product, G&A).
- Operating profit — profit from core operations before financing structure and (often) before one-offs.
- Net income — after interest and tax; belongs to equity holders in the residual sense.
2.2 Matching and accruals
Accrual accounting tries to match revenues with the costs that generated them—even if cash moved in a different period.
| Event | Cash timing | Accrual treatment (typical) |
|---|---|---|
| Sell on credit | Cash later | Revenue now; receivable on balance sheet |
| Prepay rent | Cash now | Expense over the periods covered (prepaid asset) |
| Buy inventory | Cash now | Asset until sold; then COGS |
| Use equipment | Cash earlier (capex) | Expense via depreciation over life |
| Accrue bonus | Cash later | Expense now; liability until paid |
This is why a “great” sales month can still starve cash (receivables swell) and why a “bad” P&L month can still be cash-rich (customers prepaid).
2.3 Gross margin and operating margin
Plain language: gross margin asks “is the offer economically viable at the unit level?” Operating margin asks “after we pay to run the company, is the core business earning?”
| Margin signal | Common reading | Questions to ask |
|---|---|---|
| Gross margin falling | Pricing pressure, mix shift, cost inflation, recognition changes | Is COGS definition stable? Mix by product? |
| Gross up, operating down | OpEx ballooning (sales hire, R&D, overhead) | Investment or waste? Payback path? |
| Operating up via “other” | One-offs, asset sales, accounting shifts | Recurring? |
| Net up while operating flat | Interest, tax, or below-the-line items | Financing games? |
2.4 Depreciation is not a cash ritual
Depreciation allocates past capital spending across future periods. It reduces profit without reducing cash in the depreciation period. Cash left when you bought the asset (or when you finance it).
Managers who treat depreciation as “fake” and ignore replacement needs eventually face a capex cliff. Managers who treat every depreciation dollar as sacred cash sometimes under-invest. Financial intelligence holds both truths: non-cash expense and real economic wear.
2.5 Practitioner checklist — income statement
- Start at revenue quality: recognition policy, returns, concentration, backlog vs. booked.
- Inspect gross margin by product/segment before celebrating total profit.
- Classify OpEx into run-the-business vs. change-the-business.
- Ask which expenses were capitalised instead of expensed (and why).
- Read footnotes / management discussion for non-GAAP adjustments—then decide if you agree.
3. The balance sheet: what we own, what we owe, what’s left
3.1 The fundamental equation
Plain language: everything the company controls that has future economic benefit is financed either by creditors (liabilities) or owners (equity).
| Side | Examples | Manager intuition |
|---|---|---|
| Current assets | Cash, receivables, inventory, short-term prepaids | Near-term operating fuel |
| Non-current assets | PP&E, capitalised software, long-term investments, goodwill | Capacity and past bets |
| Current liabilities | Payables, accrued expenses, short-term debt, deferred revenue | Bills and obligations due soon |
| Non-current liabilities | Long-term debt, long lease liabilities, deferred tax | Structural financing |
| Equity | Capital contributed, retained earnings, other comprehensive income | Owners’ residual claim |
3.2 Why the balance sheet feels “stale” but isn’t
Historical cost means many assets sit at old purchase prices minus depreciation—not at market value. That can understate (real estate bought decades ago) or overstate (obsolete inventory not yet written down).
Goodwill is especially soft: it is the premium paid in an acquisition over identifiable net assets. It is not “cash in a vault.” Impairment tests are estimate-heavy.
3.3 Equity is not cash in the bank
Retained earnings are cumulative profits kept in the business—not a pile of spendable cash. Cash is only the cash line (and equivalents). Confusing equity with cash is a classic non-finance manager error.
3.4 Liquidity vs. solvency (preview of ratios)
- Liquidity: can we meet near-term obligations? (current assets vs. current liabilities)
- Solvency: can we meet long-term obligations? (debt vs. equity / assets; interest coverage)
A company can be solvent on paper and illiquid in practice—or liquid this quarter while structurally over-levered.
3.5 Practitioner checklist — balance sheet
- Scan cash + receivables + inventory − payables as a rough operating footprint.
- Watch deferred revenue: liability that often foreshadows future recognised sales (and cash already collected).
- Question goodwill and intangibles as a share of total assets.
- Check debt maturity ladder—not only total debt.
- Ask: if we had to mark soft assets to reality, what breaks?
4. Cash is king: why profit is not cash
4.1 The manager’s most expensive confusion
Profit is an accrual opinion about a period. Cash is what pays salaries, vendors, lenders, and tax authorities.
A company can show profit and run out of cash when:
- Customers pay slowly (receivables up).
- Inventory builds faster than sales.
- Large capex hits.
- Debt principal is repaid (not an expense).
- Taxes or deposits timing bites.
A company can show a loss and still generate cash when:
- Depreciation is large relative to cash costs.
- Working capital releases (collect receivables, sell inventory, stretch payables carefully).
- Customers prepay.
4.2 The cash flow statement in three buckets
| Section | Meaning | Typical contents |
|---|---|---|
| Operating | Cash from core business | Net income ± non-cash items ± working-capital changes |
| Investing | Cash for long-term assets / investments | Capex, acquisitions, asset sales |
| Financing | Cash from/to capital providers | Debt draw/repay, equity issue, dividends, buybacks |
Indirect method (most common for operating): start with net income, add back non-cash expenses (depreciation), then adjust for changes in working-capital accounts.
4.3 Free cash flow (manager’s working definition)
A practical formulation many operators use:
Plain language: cash generated by the business after maintaining/expanding the asset base needed to keep going—before deciding how to pay financiers (exact definitions vary; be explicit in models).
For AI and digital products, “capex” may be light while operating cash burns on cloud, models, and people—so always map the definition to your cost shape. See Financial Modelling for AI.
4.4 Profit ≠ cash — worked intuition table
| Scenario | P&L effect | Cash effect |
|---|---|---|
| Credit sale | Revenue ↑ | Cash unchanged until collection |
| Collect old receivable | None (already booked) | Cash ↑ |
| Buy inventory with cash | None until sold | Cash ↓ |
| Sell inventory | COGS ↑; revenue if sold | Cash ↑ if cash sale |
| Depreciate machine | Expense ↑ | No cash move this period |
| Buy machine with cash | Usually none (balance sheet) | Cash ↓ (investing) |
| Borrow money | None (usually) | Cash ↑ (financing) |
| Repay loan principal | None | Cash ↓ |
| Pay interest | Expense ↑ | Cash ↓ |
4.5 Practitioner checklist — cash
- In every ops review, show cash next to profit—never profit alone.
- Explain the bridge: profit → working capital → capex → financing.
- Treat growing receivables + growing inventory as a cash tax on growth.
- For projects, demand a cash timeline, not only an ROI %.
- Never approve a plan that is “profitable in year 2” without a funding plan for year 1.
5. Ratios: diagnostics, not destiny
5.1 Why ratios exist
A raw profit of “$10 million” means nothing without scale, capital, and risk context. Ratios normalise. They also embed the same estimates as the statements—so garbage in, ratio out.
Use ratios to:
- Compare periods (trend).
- Compare peers (benchmark).
- Trigger questions (not automatic conclusions).
5.2 Profitability ratios
| Ratio | Formula (plain) | Asks |
|---|---|---|
| Gross margin | Gross profit ÷ Revenue | Unit economics strength |
| Operating margin | Operating profit ÷ Revenue | Core business efficiency |
| Net margin | Net income ÷ Revenue | Bottom-line yield on sales |
| ROA | Net income ÷ Average total assets | Profit per asset dollar |
| ROE | Net income ÷ Average equity | Profit per owner dollar |
| ROIC (conceptual) | NOPAT ÷ Invested capital | Return on capital used in operations |
Leverage caution on ROE: high debt can juice ROE while increasing risk. Always read ROE with leverage and interest coverage.
5.3 Liquidity ratios
Plain language: current ratio includes inventory; quick ratio asks whether you can pay near-term bills without relying on selling stock.
| Pattern | Possible story |
|---|---|
| Current ratio rising via inventory | Liquidity illusion; stock may be stale |
| Quick ratio falling while current stable | Inventory dependence increasing |
| Both falling in growth | Working-capital strain—fund it deliberately |
5.4 Leverage and coverage
Plain language: how much of the capital structure is borrowed, and how many times operating profit could pay interest.
5.5 Efficiency / activity ratios
(Exact denominators vary by firm practice; stay consistent.)
These feed the cash conversion cycle in Section 7.
5.6 Practitioner checklist — ratios
- Never cite a ratio without trend + peer + definition.
- Decompose margin moves into price, volume, mix, cost.
- Read ROE with leverage; read ROA/ROIC for operating truth.
- Pair liquidity ratios with the cash flow statement.
- If a ratio “improves” via estimate change alone, label it cosmetic.
6. ROI and investment decisions: methods that disagree
6.1 What managers mean by “ROI” (and why finance winces)
In hallway language, ROI often means:
Problems: which gain (profit? cash? annual? lifetime)? which cost (initial only? fully loaded)? over what time? with what risk?
Financial intelligence replaces slogan ROI with explicit methods.
6.2 Payback period
Question: how long until cumulative cash inflows recover the initial outflow?
| Pros | Cons |
|---|---|
| Simple; cash-focused; good risk screen | Ignores cash after payback; ignores time value unless discounted |
Use as a hurdle filter, not as the sole ranking tool for long-lived assets.
6.3 NPV (net present value)
Plain language: discount future cash flows at a rate (r) that reflects risk and capital cost; sum them; subtract (or include) initial investment. Positive NPV at the right (r) creates value.
| Choice | Effect if you get it wrong |
|---|---|
| Discount rate too low | Approve value-destroying projects |
| Discount rate too high | Reject good projects |
| Cash flows too optimistic | NPV theatre |
| Terminal value dominant | Tiny assumption changes swing decision |
6.4 IRR (internal rate of return)
IRR is the discount rate that makes NPV = 0. Compare IRR to a hurdle rate.
Caveats: multiple IRRs with sign-flipping cash flows; scale blindness (small project, huge IRR); mutually exclusive projects can rank differently under NPV vs. IRR—prefer NPV for ranking when capital is the constraint story you care about.
6.5 Accounting rate of return / ROI on book
Some organisations use average accounting profit ÷ book investment. It ties to how the P&L will “look,” which can matter politically—but it can diverge sharply from cash NPV.
6.6 Method comparison table
| Method | Primary lens | Best use | Main trap |
|---|---|---|---|
| Payback | Speed of cash recovery | Risk screen, liquidity-aware cultures | Ignores later value |
| NPV | Value created in money today | Primary go/no-go and ranking | Garbage cash flows / wrong (r) |
| IRR | Yield % | Communicate return vs. hurdle | Ranking & reinvestment assumptions |
| Accounting ROI | P&L optics | Incentive alignment discussions | Not cash; estimate-sensitive |
| Hallway ROI | Rhetoric | None without definition | False precision |
6.7 Practitioner checklist — ROI conversations
- Force a definition card: metric, cash vs. profit, time horizon, discount rate, sensitivity.
- Show base / upside / downside cash flows—not a single heroic case.
- Separate investment decision (NPV) from financing decision (how we fund it).
- For AI programmes, tie benefits to observable operating drivers (containment, hours, error rates)—see Financial Modelling for AI.
- If ROI improved only by stretching asset life or capitalising cost, call the bias.
7. Working capital and the cash conversion cycle
7.1 Working capital defined
A tighter operating view often focuses on:
(plus/− deferred revenue and other operating items as relevant).
Plain language: working capital is the cash tied up in the operating cycle—money waiting in customer invoices and stock, partly offset by what you still owe suppliers.
7.2 Cash conversion cycle (CCC)
Plain language:
- DIO — days inventory sits before becoming a sale/COGS.
- DSO — days to collect after the sale.
- DPO — days you take to pay suppliers.
- CCC — net days your cash is stuck in the cycle.
| CCC move | Typical meaning | Healthy vs. reckless |
|---|---|---|
| DSO down | Faster collections | Healthy if service quality holds |
| DIO down | Leaner inventory | Healthy if stockouts don’t destroy sales |
| DPO up | Slower payment | Can be smart or supplier-abusive / costly |
| CCC down | Less cash trapped per day of operations | Usually good if sustainable |
7.3 Growth consumes cash
Even profitable growth increases receivables and inventory. If CCC is 60 days and revenue jumps, you may need a cash injection simply to fund the cycle. This is why hypergrowth companies with “great margins” still raise capital.
7.4 Manager levers by function
| Function | Working-capital levers |
|---|---|
| Sales | Credit terms, discount for early pay, pipeline quality (avoid fake bookings) |
| Delivery / ops | Cycle time, inventory accuracy, scrap, release-to-bill speed |
| Procurement | Payment terms, consignment, vendor-managed inventory |
| Finance | Billing discipline, collections process, dispute resolution |
| Product / AI ops | Usage-to-invoice latency; cloud commit vs. on-demand cash shape |
7.5 Practitioner checklist — working capital
- Report CCC components monthly for any cash-sensitive business.
- Tie sales incentives to collectible revenue, not only booked revenue.
- Before a growth push, model incremental working capital.
- Treat deferred revenue carefully: cash-positive now, delivery obligation later.
- Never “improve” CCC only by starving suppliers if that raises price, risk, or quality loss.
8. Building a financially intelligent company
8.1 Literacy is a management system, not a course
A financially intelligent company:
- Teaches managers the three statements and the profit≠cash bridge.
- Makes assumptions visible in forecasts and close packs.
- Uses ratios as questions, not scoreboard violence.
- Aligns incentives with cash and economic profit, not only accrual cosmetics.
- Gives non-finance leaders permission to challenge estimates respectfully.
8.2 Meeting design that spreads intelligence
| Forum | Finance-intelligent habit |
|---|---|
| Monthly ops review | Profit, cash, CCC, one soft-estimate callout |
| Project gate | NPV/cash timeline + sensitivity; explicit benefit owners |
| Pricing review | Gross margin by offer; working-capital impact of terms |
| Forecast call | Assumption register (volume, price, hire, churn, recognition) |
| Board pack | Bridge from EBITDA/profit to free cash flow |
8.3 Red flags of a financially unintelligent culture
- Nobody outside finance can explain deferred revenue.
- “EBITDA always” without cash or capex context.
- ROI slides with no cash flows attached.
- Bonuses on revenue that ignore collectibility.
- Surprise impairments and “one-time” items every year.
- Growth celebrated while the revolver quietly maxes out.
8.4 For consultants and AI solution teams
Your client’s CFO hears “ROI” ten times a week. Differentiate by:
- Showing the assumption tree.
- Separating P&L benefit, cash timing, and balance-sheet effects (e.g., capitalised build vs. opex run).
- Mapping FinOps quantities (tokens, GPU hours) to outcome unit economics—Model FinOps.
- Stressing working capital and adoption lag in digital programmes.
- Leaving behind a one-page financial glossary for the operating team.
8.5 Practitioner checklist — organisational habits
- Run a 90-minute financial intelligence workshop for every new manager cohort.
- Require an assumption register on every material forecast.
- Put cash on the same slide as profit in all operating reviews.
- Audit incentive metrics for accrual gaming potential.
- Celebrate teams that find bias early, not only teams that hit a number.
9. Integrated practitioner map
| Book theme | Core idea | Default question |
|---|---|---|
| Art of finance | Estimates and bias shape “facts” | What judgment sits under this line? |
| Income statement | Profit is matched accruals | Is revenue quality real? Are margins clean? |
| Balance sheet | Snapshot of financing and assets | What is soft? What is due soon? |
| Cash | Profit ≠ cash | Where did the cash go? |
| Ratios | Normalised diagnostics | Trend, peer, definition? |
| ROI | Competing methods | NPV cash story or % theatre? |
| Working capital | Operations trap or release cash | What is our CCC and why? |
| Intelligent company | Shared literacy | Who can challenge the estimate? |
9.1 One-page close / review pack (recommended)
- Revenue and gross margin bridge (price/volume/mix/cost).
- Operating profit bridge.
- Cash bridge (profit → WC → capex → financing).
- CCC waterfalls (DSO/DIO/DPO).
- Top three estimate sensitivities.
- Decision asks (hire, price, invest, cut, fund).
10. Closing: from intimidation to inquiry
Financial Intelligence does not try to turn every manager into an accountant. It tries to end the intimidation asymmetry—the sense that finance is a priesthood and everyone else is a passenger.
Once you internalise that statements are rule-bound stories filled with estimates, you gain a permanent advantage:
- You know why profit can rise while cash falls.
- You know which ratios answer which questions.
- You know when “ROI” is a decision tool and when it is a sales word.
- You know that working capital is strategy expressed as timing.
- You know that the highest-leverage cultural move is teaching others to ask the same questions.
That is financial intelligence: not memorising debits and credits, but seeing the art, checking the bias, and following the cash.
Discussion
Comments
Share feedback or questions about this page. No account required.
Loading comments…